Creating Tilray's Power BI reports using Python
Summary
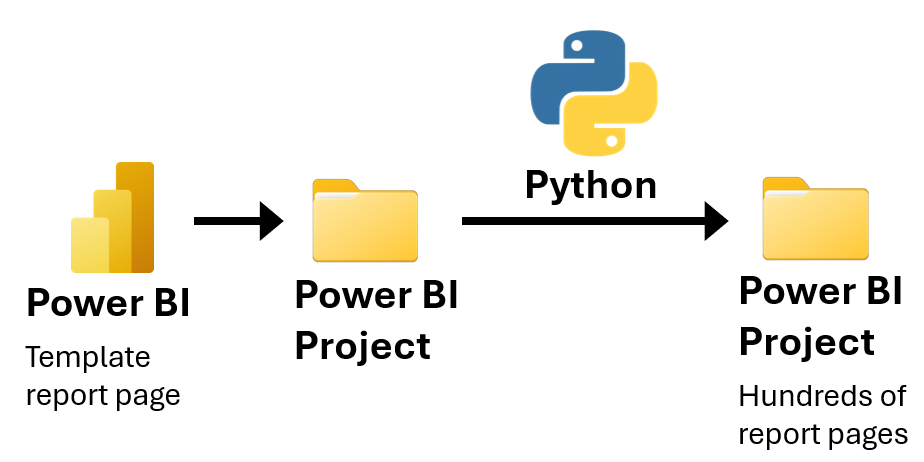
Problem: The analytics team needed to create hundreds of Power BI report pages, each presenting the result of a different database query.
Solution: I wrote a Python script to automate the creation of the Power BI report pages by editing the files in a Power BI Project folder.
Results: The Python script saved days of work for my team. Without the script, we would have had to manually create the report pages using the Power BI graphical user interface (GUI).
Power BI Projects (PBIP)
A Power BI Project (PBIP) defines a Power BI report using a folder of plain text files (PBIP documentation). By using PBIPs, we can edit Power BI reports using a programming language, such as Python.
.SemanticModel folder
Defines the data tables that are used to create the data visualizations in the report pages.
- Each
.tmdlfile in thetablesfolder defines a semantic model table. For example, the file contains the Power Query M code that produces the table.
.pbip file
A Power BI report such that changes made to the .Report and .SemanticModel folders will change the .pbip file. Furthermore, changes made to the .pbip file using the Power BI GUI will change the .Report and .SemanticModel folders.
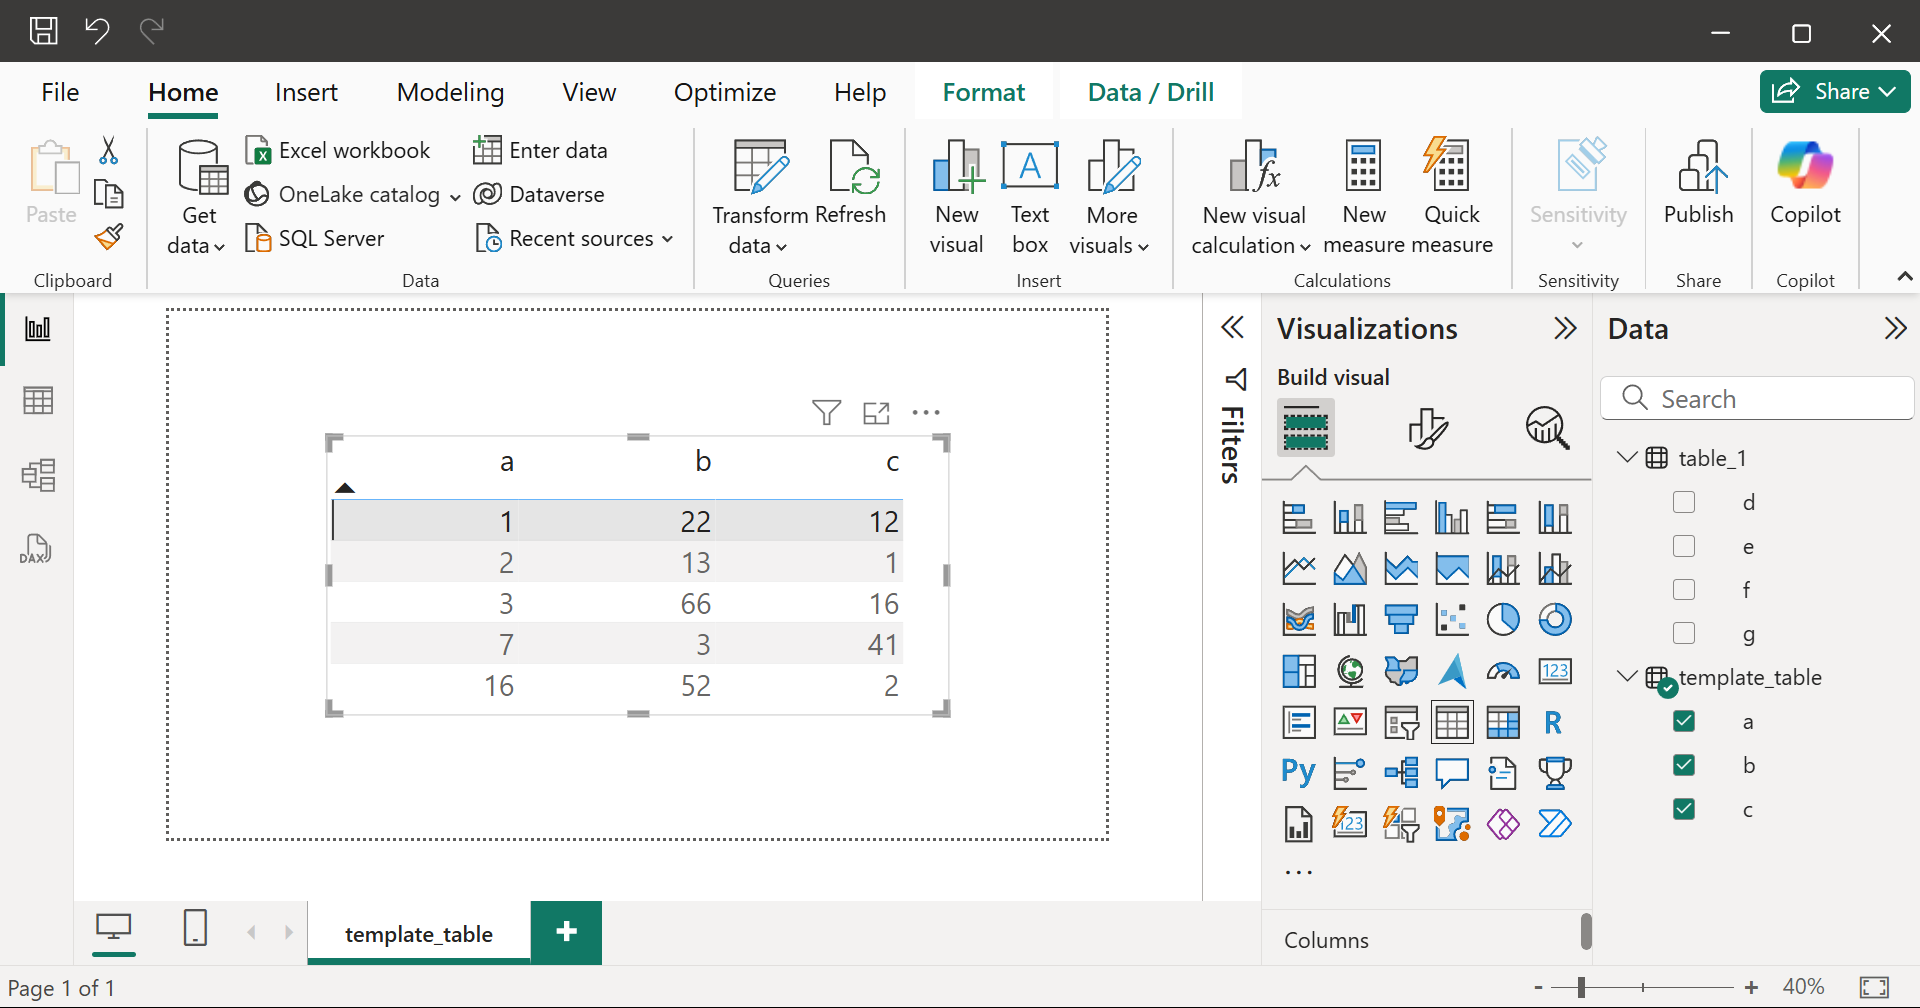
I used the Power BI GUI to create a template_table report page, which presents the data from the template_table semantic model table. The template_table report page defines the appearance of the report pages that the Python script will create.
project.pbip
.Report folder
Defines all the report pages in the Power BI report.
 📂definition
 ┣ 📂pages # (1)!
 ┃ ┣ 📂template_table
 ┃ ┃ ┣ 📂visuals
 ┃ ┃ ┃ ┗ 📂table_visual
 ┃ ┃ ┃ ┃ ┗ 📜visual.json # (2)!
 ┃ ┃ ┗ 📜page.json
- Each folder in the
pagesfolder defines a report page. - Each
visual.jsonfile defines a data visualization. For example, the file specifies the type of data visualization, and which semantic model tables to use to create the visualization.
Python code
I used the following Python packages:
-
pathlibto represent filesystem paths. -
shutilto copy files and folders. -
reto parse.tmdlfiles using regular expressions. -
jsonto edit.jsonfiles. -
typingto add type hints.
1. Create variables.
project_path = Path(r"") # paste the path to the Power BI project folder
pages_path = project_path / ".Report" / "definition" / "pages"
tables_path = project_path / ".SemanticModel" / "definition" / "tables"

new_table_name = "table_1"
new_page_name = new_table_name
2. Extract the column names of each semantic model table from the
.tmdl files.
def get_column_names() -> Dict[str, List[str]]:
    table_name_to_column_names = dict()
    for table_tmdl_path in tables_path.glob('*.tmdl'):
        table_name = (re
                      .search(r'.*\\(.*)\.tmdl$', str(table_tmdl_path))
                      .group(1)
                      )
        with open(table_tmdl_path, 'r') as f:
            table_tmdl_data = f.read()
        column_names = re.findall(r'\n\tcolumn (.*)\n', table_tmdl_data)
        table_name_to_column_names[table_name] = column_names
    return table_name_to_column_names


table_name_to_column_names = get_column_names()
column d
    dataType: int64
    formatString: 0
    lineageTag: d8b5b183-7b7a-47a0-8219-211965773f6d
    summarizeBy: none
    sourceColumn: d

    annotation SummarizationSetBy = User

column e
    dataType: int64
    formatString: 0
    lineageTag: c55162d8-0445-42ef-9b16-236054053d6d
    summarizeBy: none
    sourceColumn: e

    annotation SummarizationSetBy = User
3. Create a copy of the template_table folder named table_1.
def copy_template_page(new_page_name: str) -> None:
    template_page_path = pages_path / "template_table"
    new_page_path = pages_path / new_page_name
    shutil.copytree(template_page_path, new_page_path)


copy_template_page(new_page_name)
4. Edit page.json to change the name of the new report page from template_table to table_1.
def edit_page_json(page_name: str) -> None:
    page_json_path = pages_path / page_name / "page.json"
    with open(page_json_path, 'r') as f:
        page_json_data = json.load(f)

    page_json_data['name'] = page_name
    page_json_data['displayName'] = page_name

    with open(page_json_path, 'w') as f:
        json.dump(page_json_data, f, indent=4)


edit_page_json(new_page_name)
5. Edit visual.json to present the columns from table_1 instead of the columns from template_table.
visual_json_column_template = ({
    "field": {
        "Column": {
            "Expression": {
                "SourceRef": {
                    "Entity": "table_name"
                }
            },
            "Property": "column_name"
        }
    },
    "queryRef": "table_name.column_name",
    "nativeQueryRef": "column_name"
})


def create_visual_json_columns(table_name: str) -> str:
    visual_json_columns = []
    for column_name in table_name_to_column_names[table_name]:
        visual_json_column = copy.deepcopy(visual_json_column_template)
        (visual_json_column['field']['Column']['Expression']
         ['SourceRef']['Entity']) = table_name
        visual_json_column['field']['Column']['Property'] = column_name
        visual_json_column['queryRef'] = f'{table_name}.{column_name}'
        visual_json_column['nativeQueryRef'] = column_name
        visual_json_columns.append(visual_json_column)
    return visual_json_columns


def edit_visual_json(page_name: str, table_name: str) -> None:
    visual_json_path = (pages_path / page_name /
                        "visuals" / "table_visual" / "visual.json")
    with open(visual_json_path, 'r') as f:
        visual_json_data = json.load(f)

    (visual_json_data['visual']['query']['queryState']['Values']
     ['projections']) = create_visual_json_columns(table_name)

    with open(visual_json_path, 'w') as f:
        json.dump(visual_json_data, f, indent=4)


edit_visual_json(new_page_name, new_table_name))
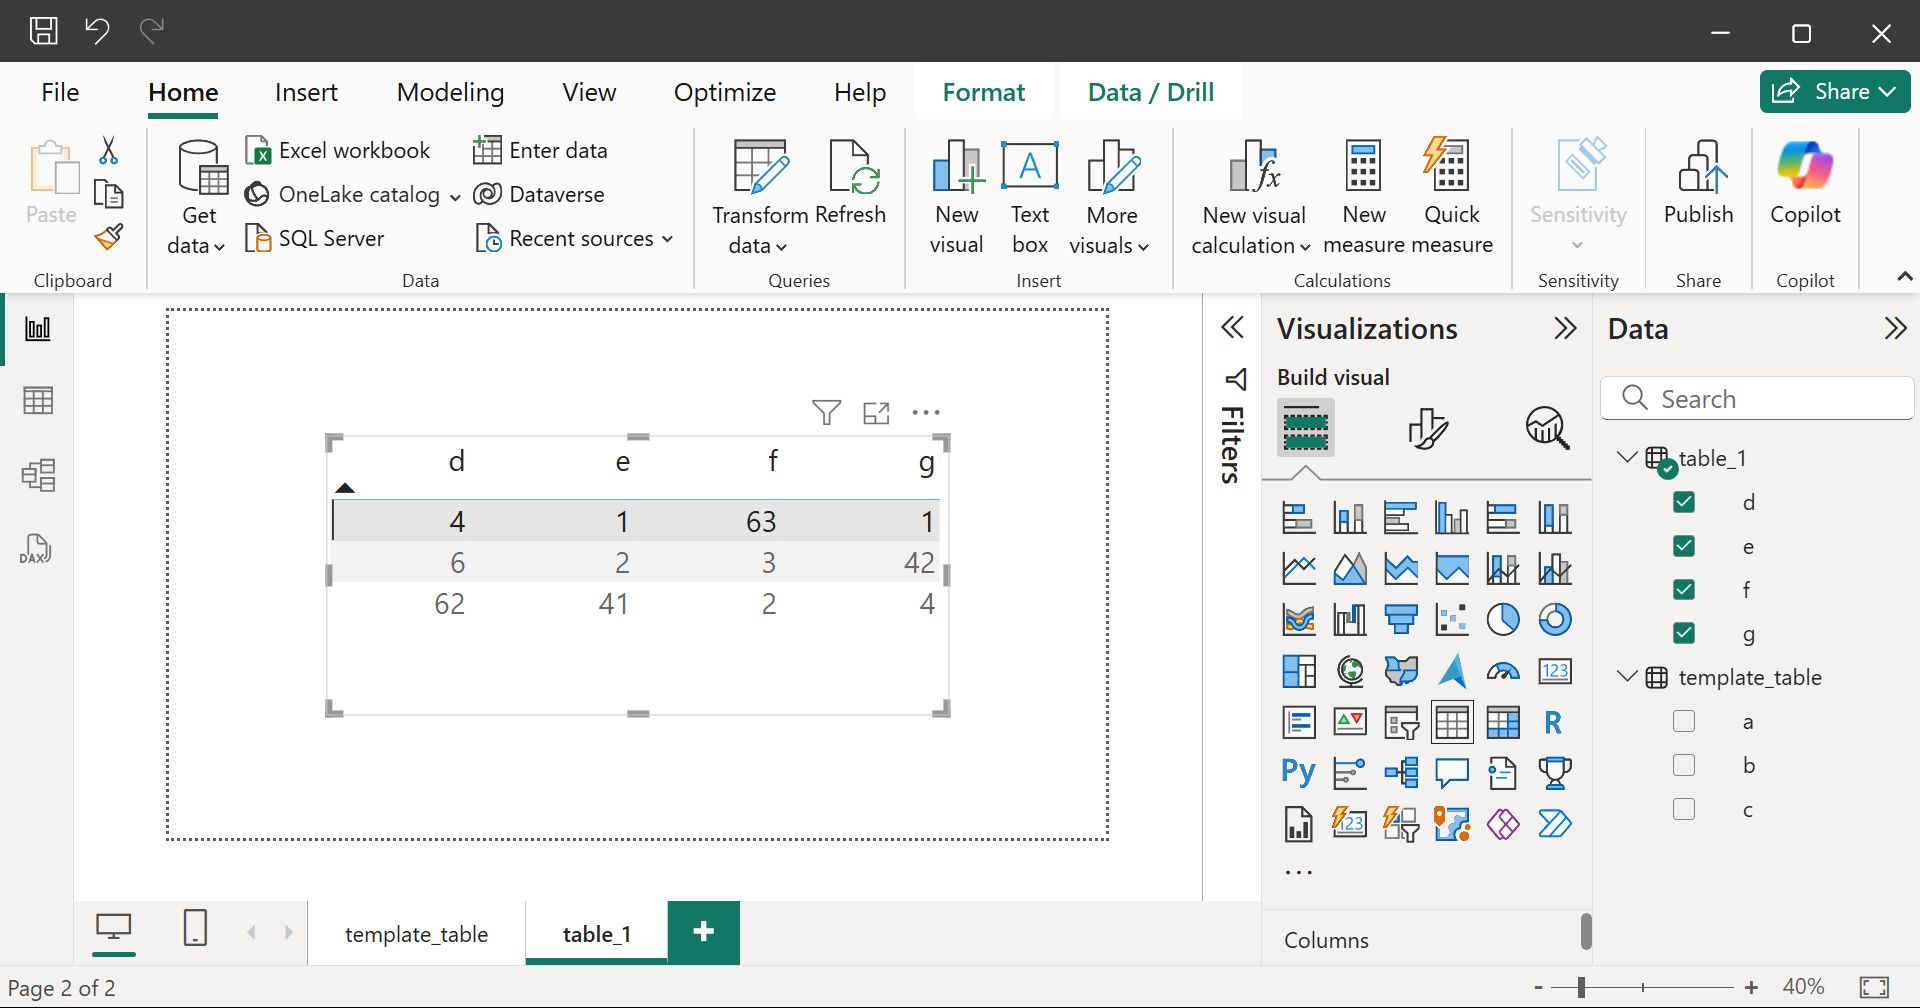
New report pages
project.pbip
project.pbip